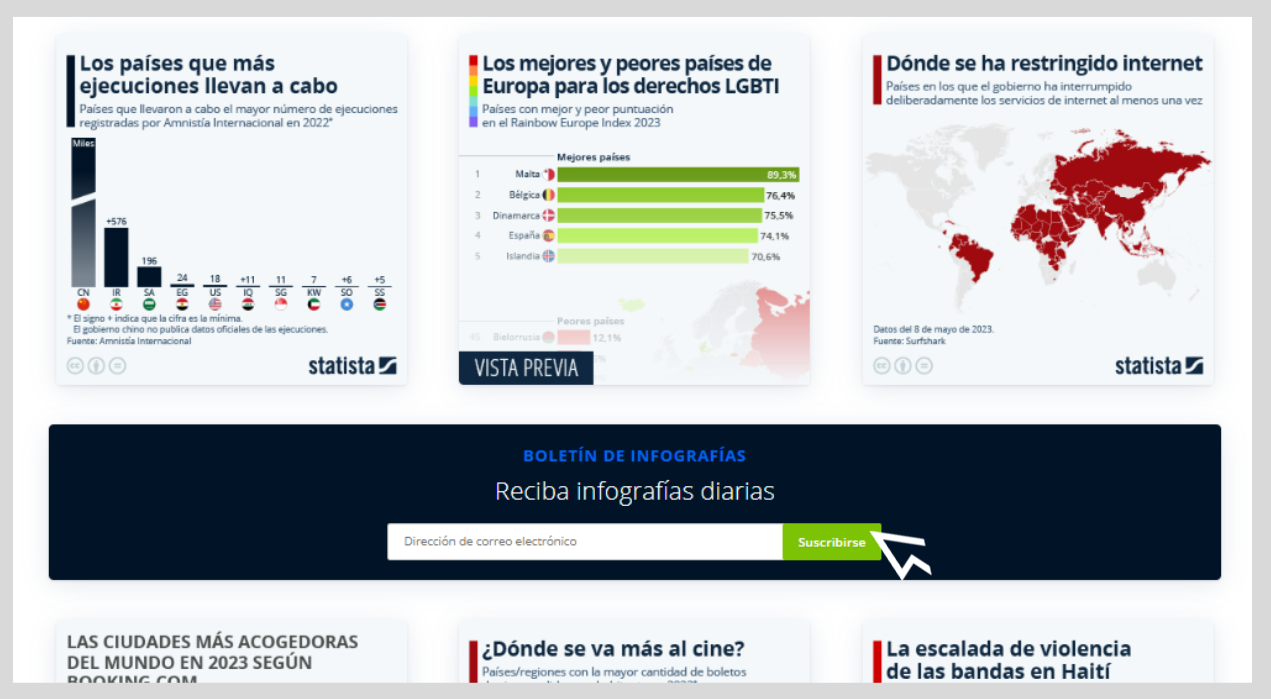
Link data and infographics from Statista to understand current affairs
Subject: Multidisciplinary
Statista is a data provider that publishes infographics every day to keep you abreast of current affairs
The Statista collection, which you can access from the UOC Library, provides statistics, reports and dossiers to bring you up to date with current topics ranging from the economy, technology, environment and health to trends in consumption.
Infographics are part of the featured content, and they present the figures from reports and research in a visual way that is easy to understand. Each infographic shows the data source from which the information was taken, so you can explore the topic in more depth.
Here are some of the latest infographics published on this platform:
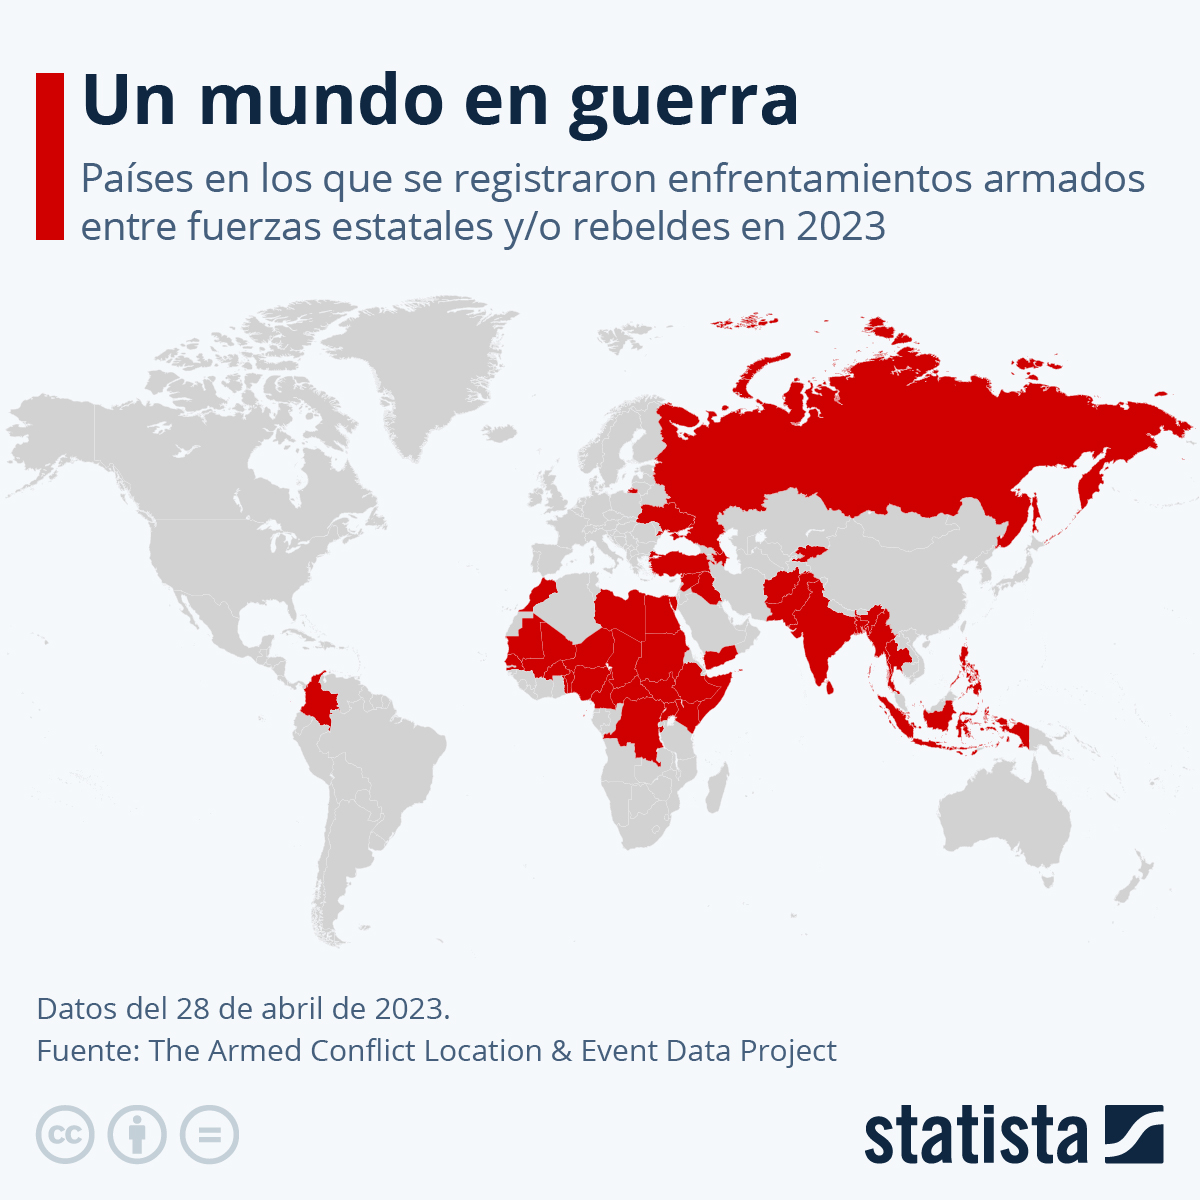
This infographic, based on data from the Armed Conflict Location & Event Data Project (ACLED), shows the countries where armed clashes between state forces and rebel groups have been reported this year.
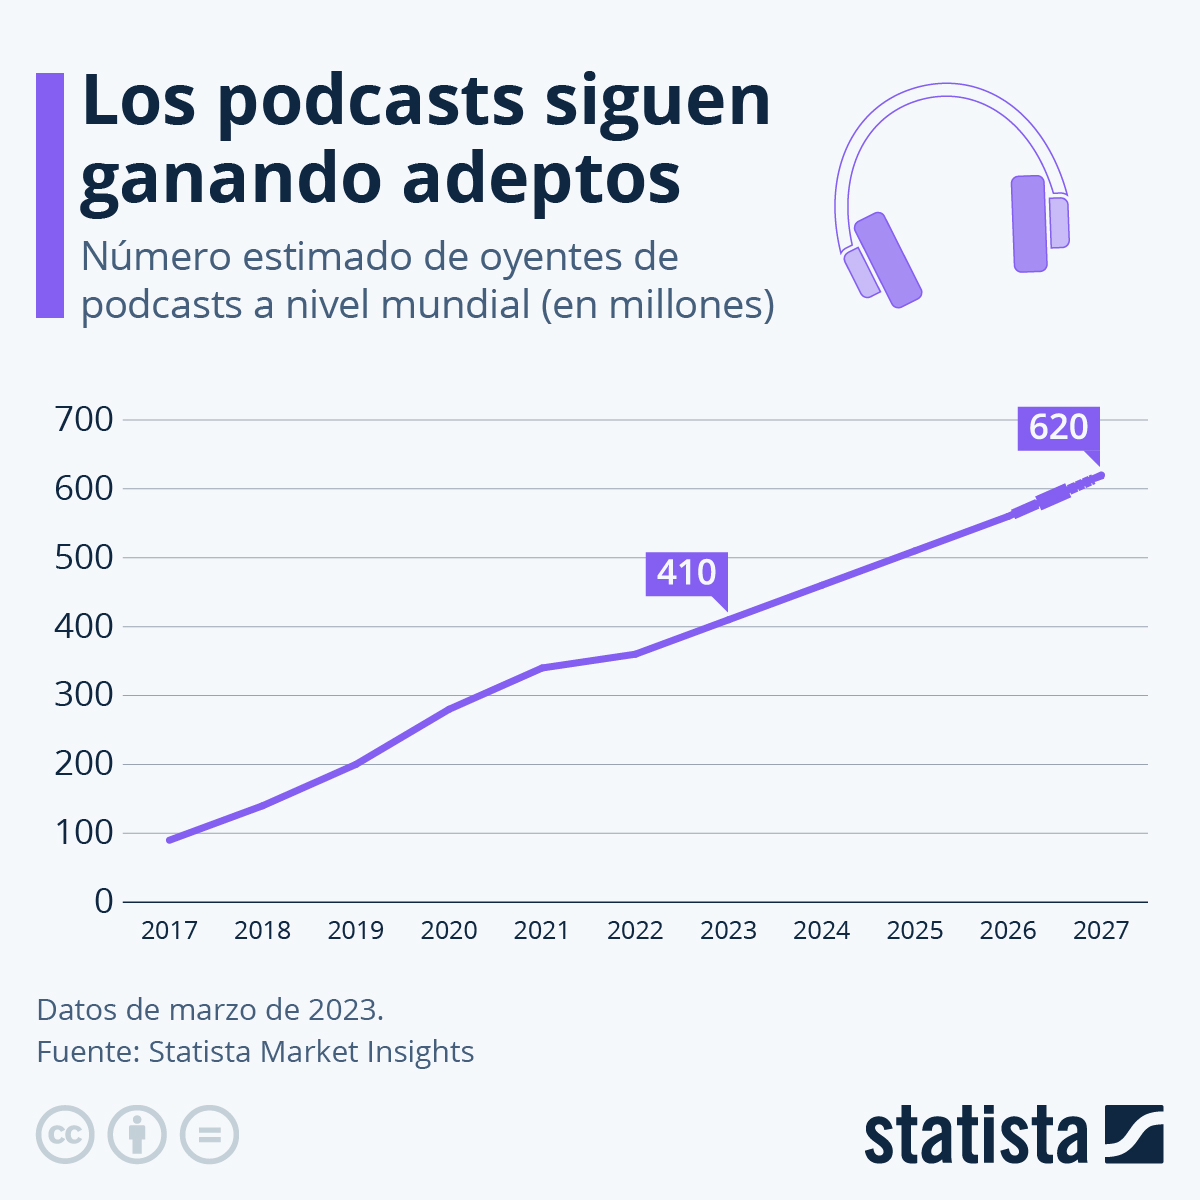
According to data from Statista, the number of people listening to podcasts will continue to increase. This infographic shows the increase in listeners in recent years in millions, and the estimated increase (this number is expected to reach 620 million by 2027).
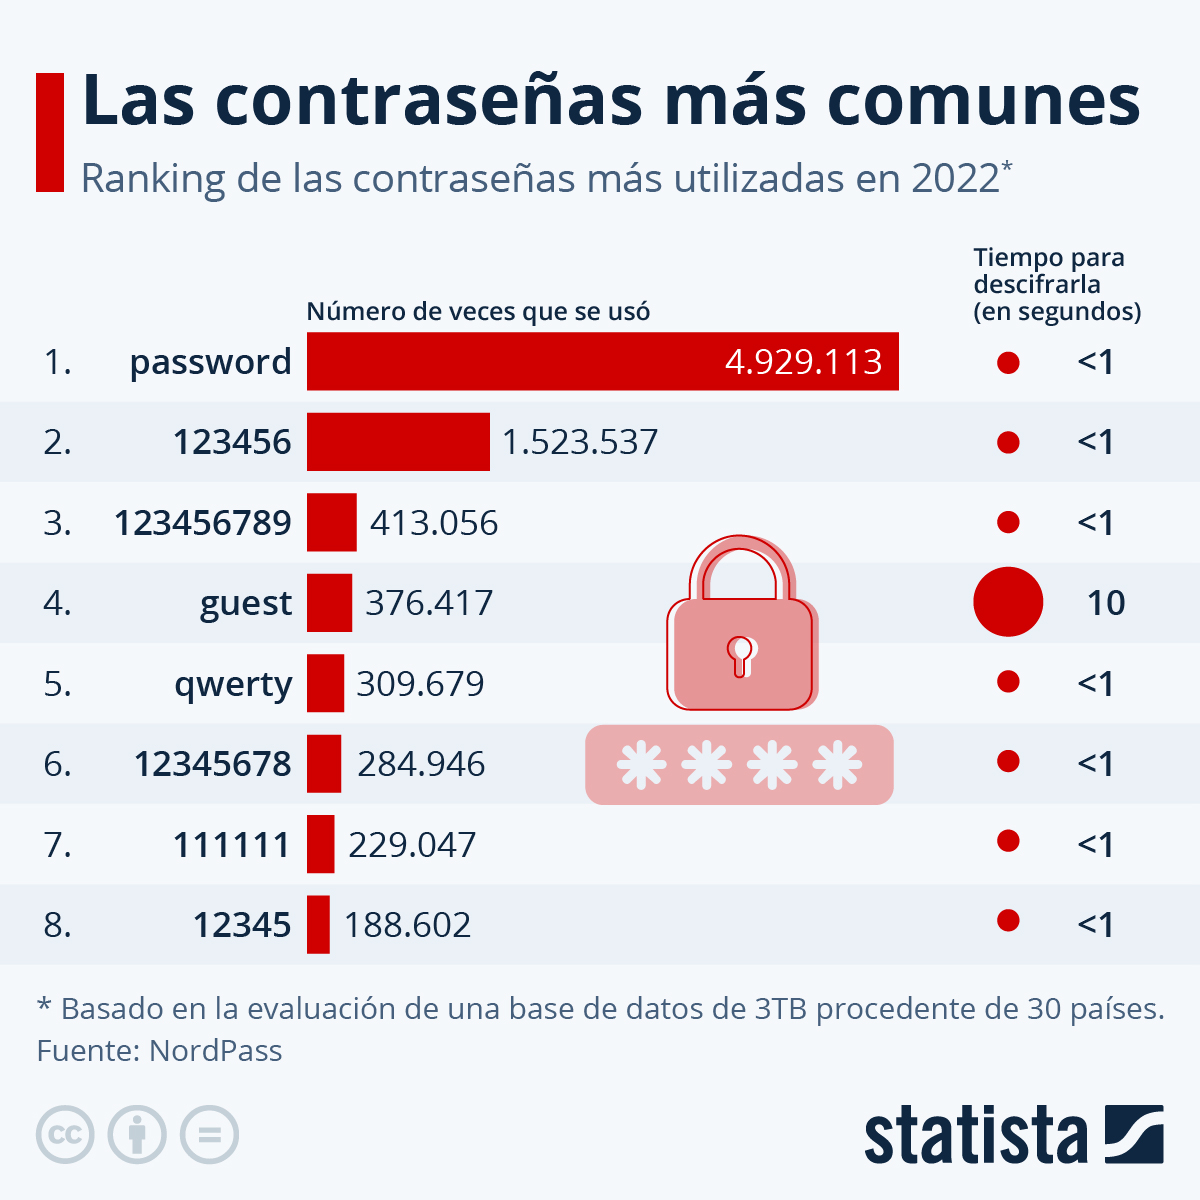
The commonest passwords around the world last year continued to be easy-to-guess combinations of numbers and words. The most commonly used was 'password', which was used nearly five million times, and is a password that hackers can crack in less than a second.
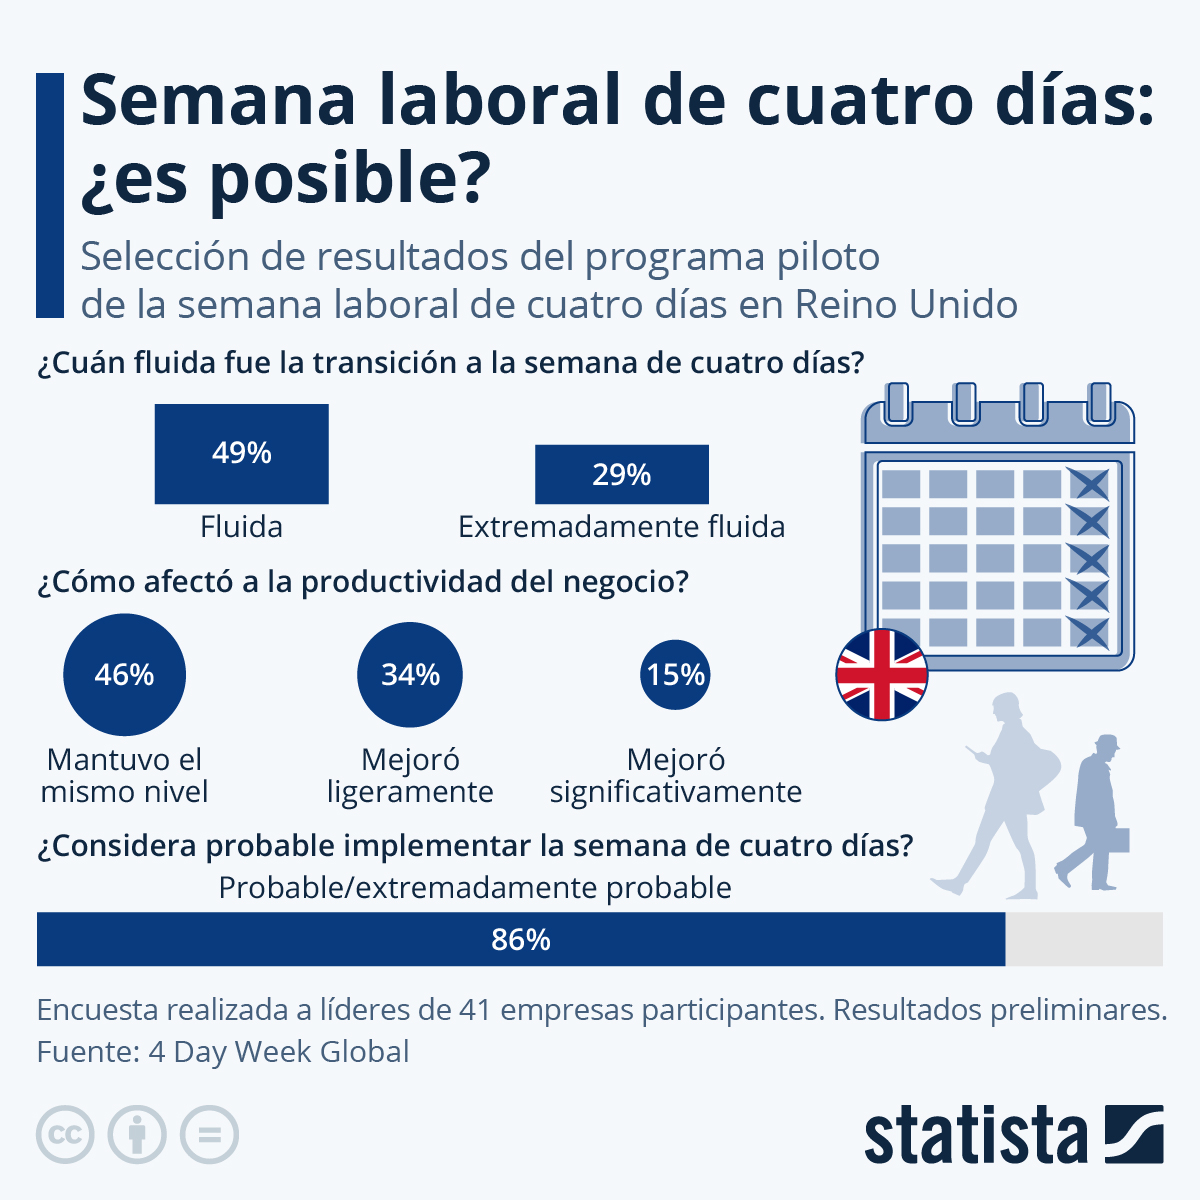
In early June, more than 3,300 employees at 73 companies in the United Kingdom began a pilot test to analyse the effectiveness and productivity of a working week comprising just four days. This infographic presents the main results of the study, in which 46% of the leaders of the 41 companies surveyed said that productivity levels remained stable.
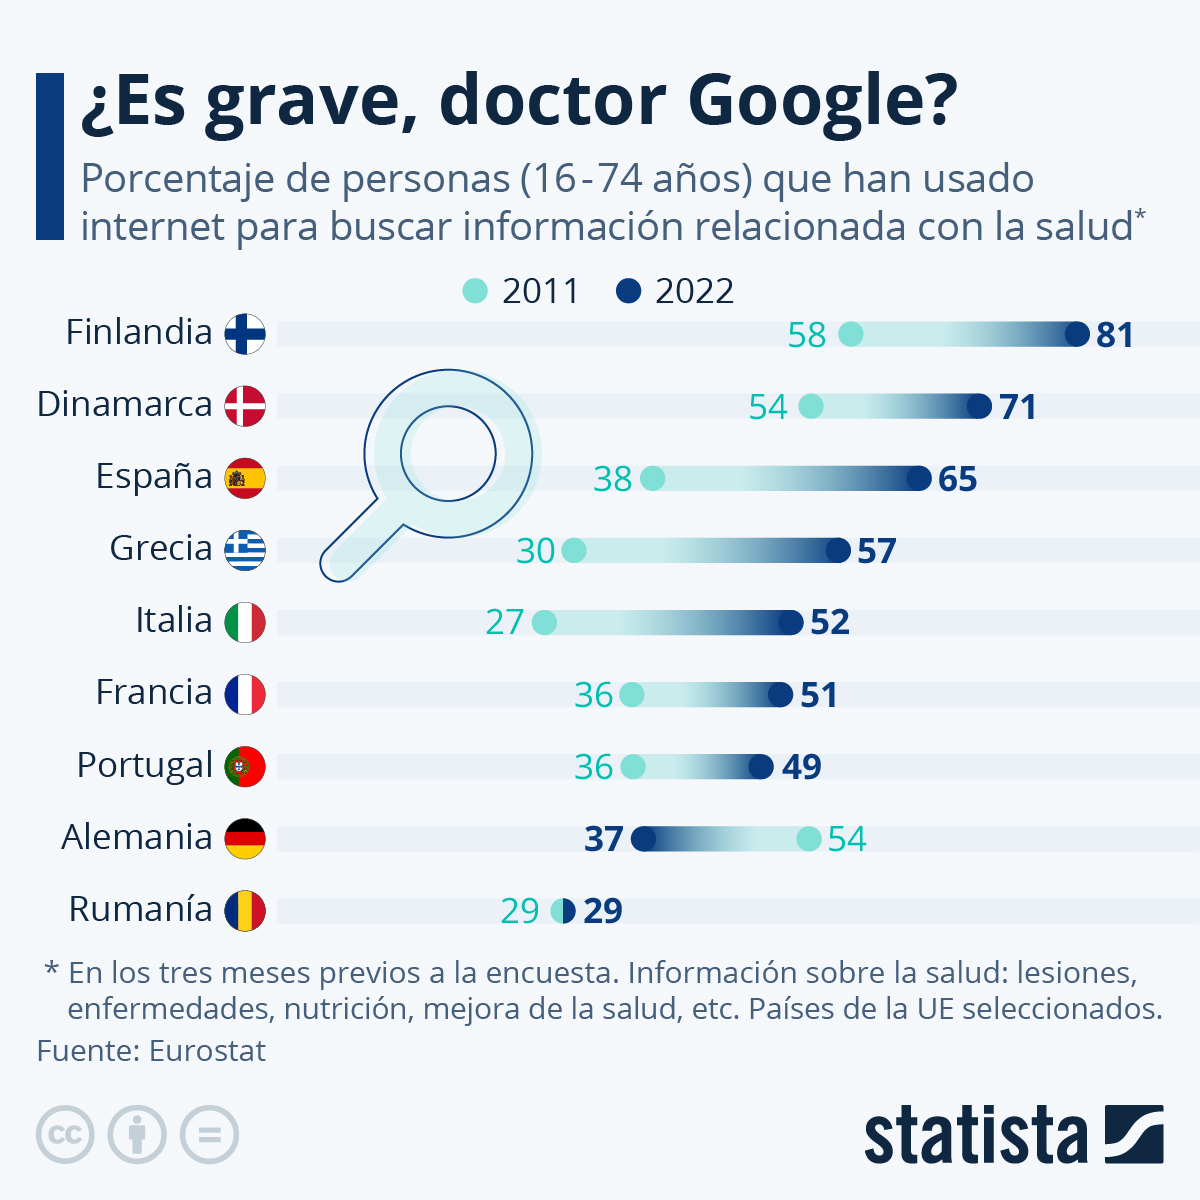
This infographic shows the percentage of people using the internet to search for information about health in 2022. According to the data, 65% of Spain's population used the web to search for health-related information in the three months prior to Eurostat's annual survey.
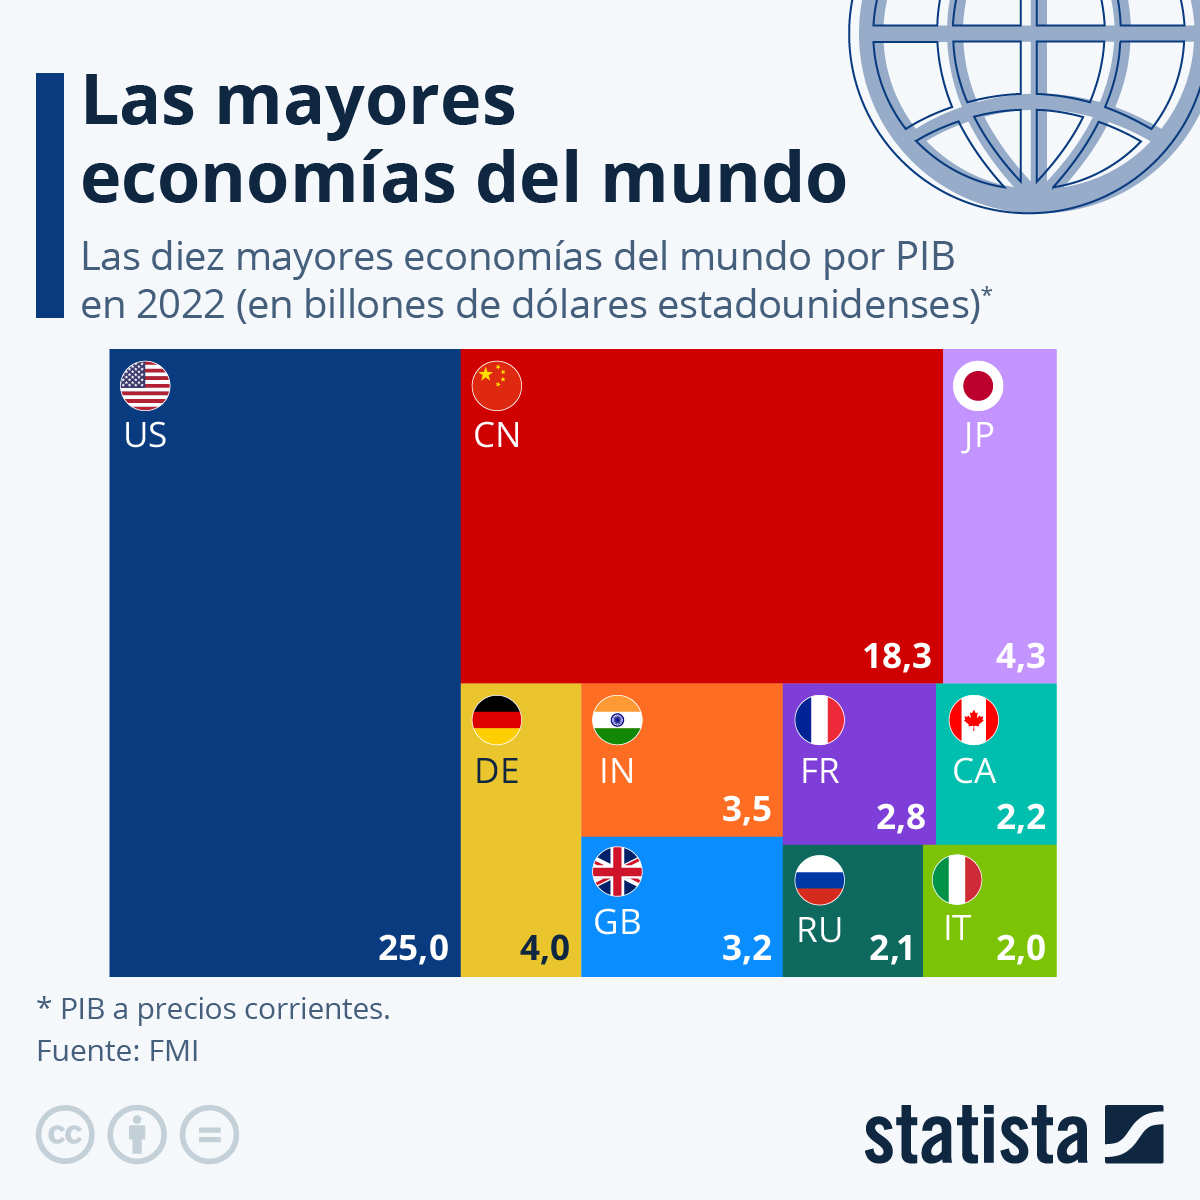
The infographic uses data from the International Monetary Fund to present the world's top ten economies in 2022 in GDP terms. The United States is in first place, followed closely by China and then, in third place, by Japan.
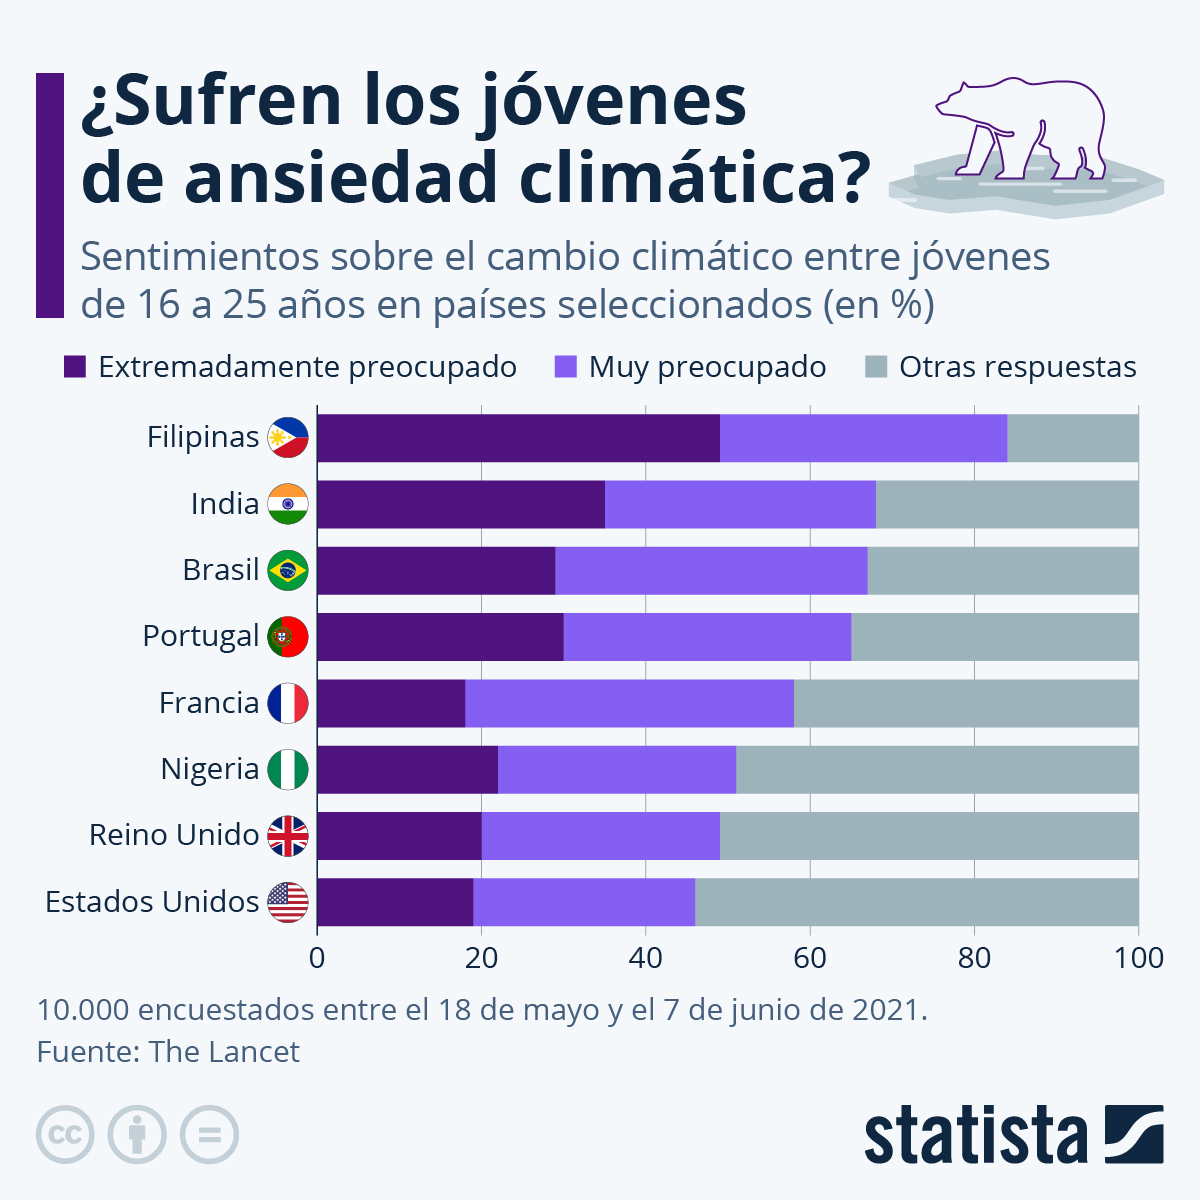
This infographic is based on a study published in The Lancet, in which 10,000 young people from several countries were interviewed. Almost 60% of the respondents said they were extremely worried or very worried about climate change.
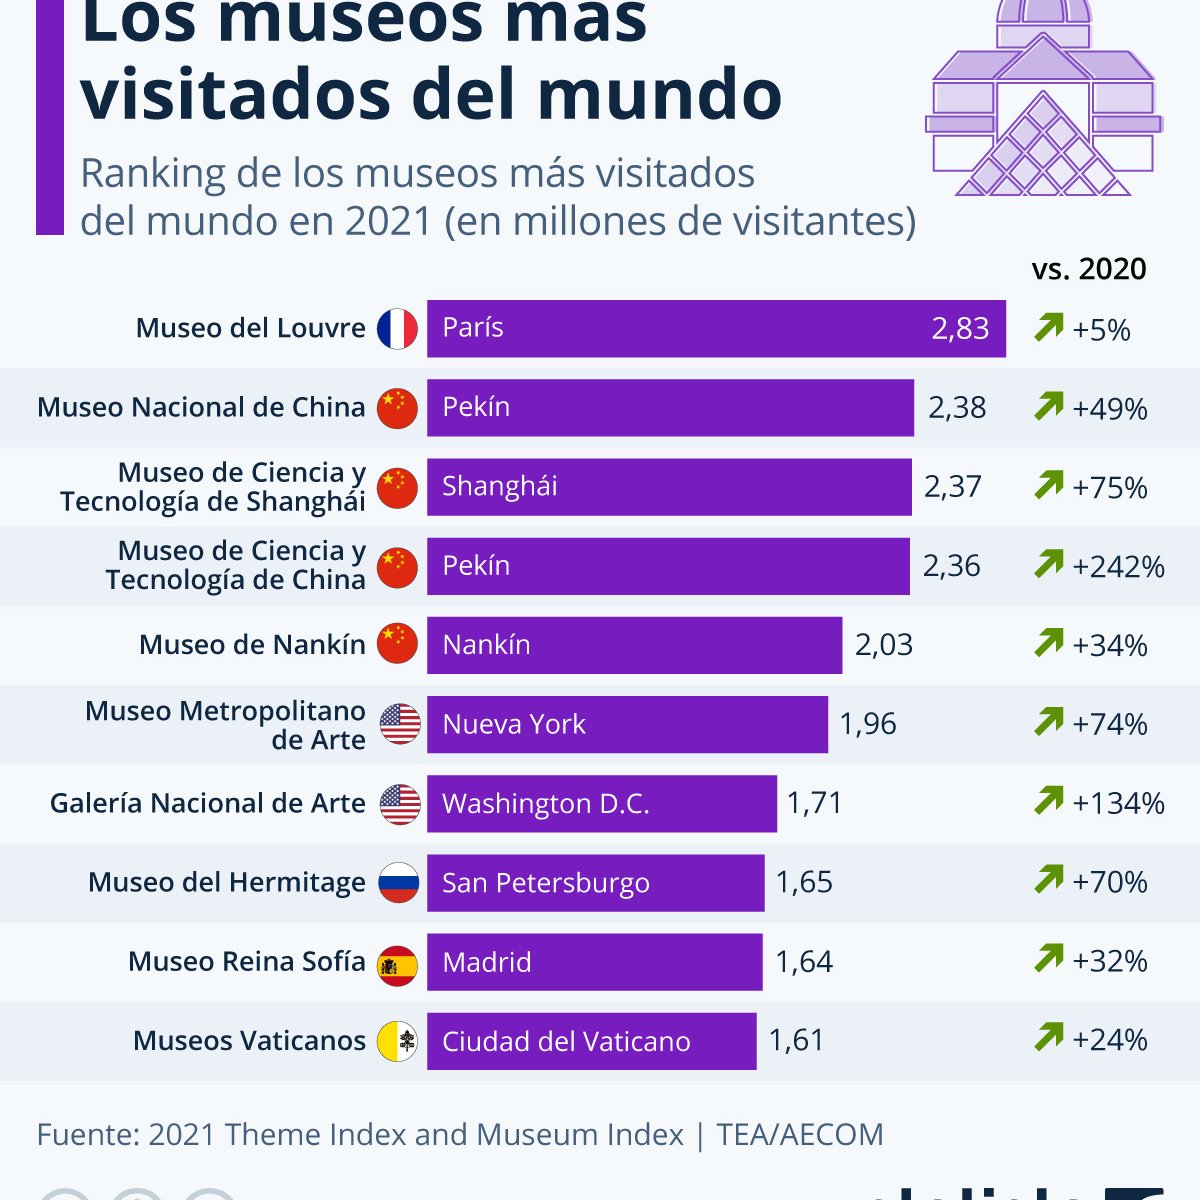
Infographic showing the world's ten most visited museums according to the 2021 Theme Index and Museum Index. The Louvre Museum in Paris (France) tops the list, which also includes a Spanish museum, the Museo Nacional Centro de Arte Reina Sofía in Madrid.
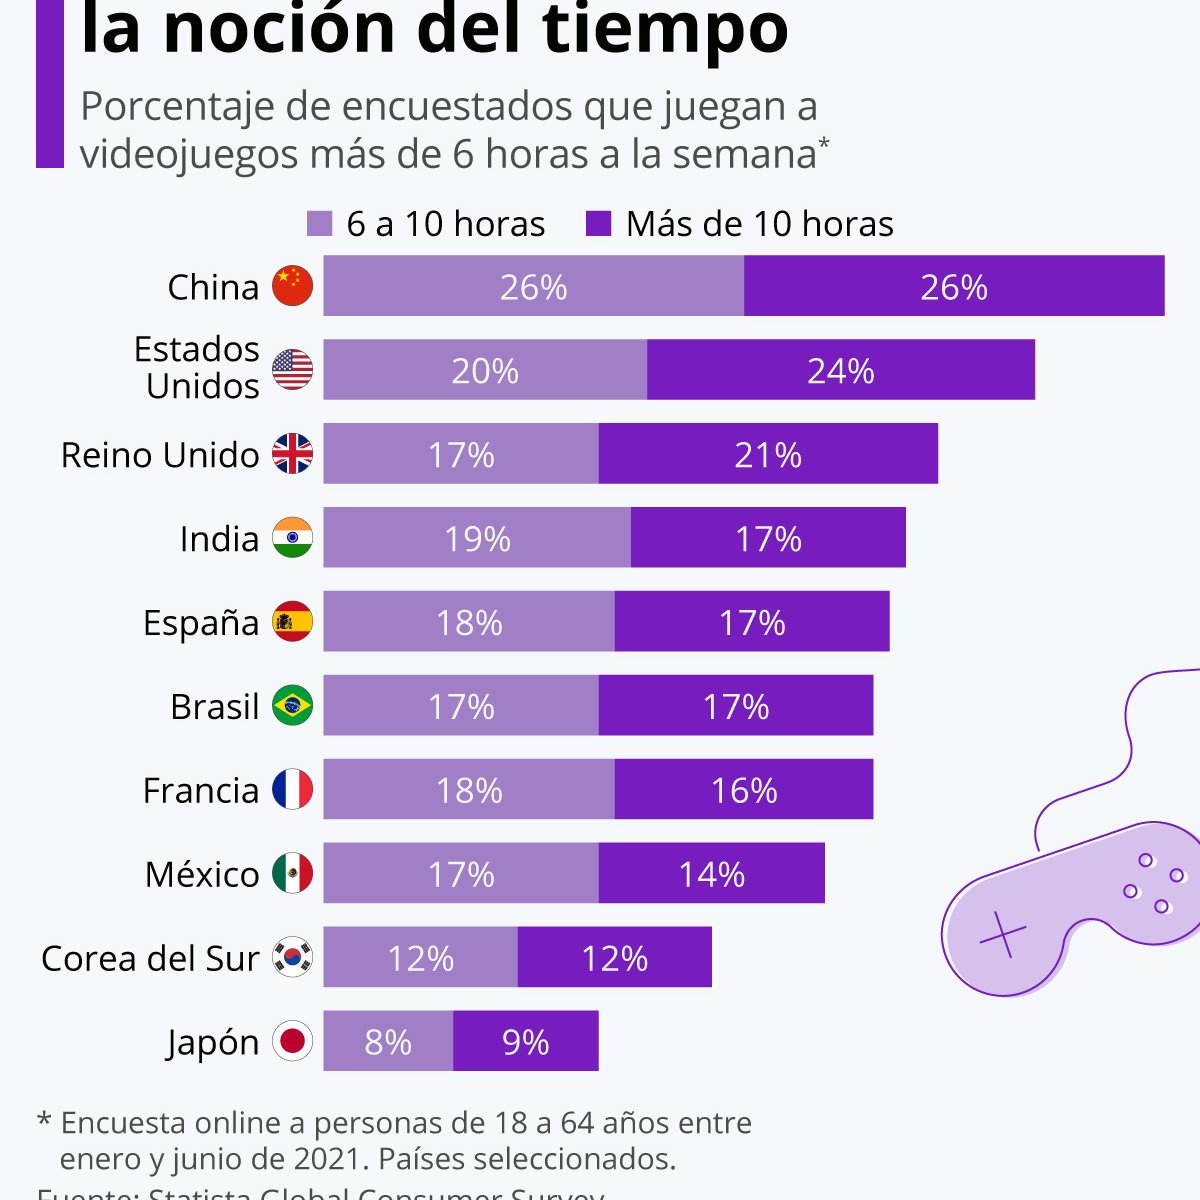
This infographic presents the results of an international survey carried out by Statista on the number of hours the interviewees spend playing video games each week. 52% of the adults aged between 18 and 64 surveyed in China say they spend more than six hours playing games each week.
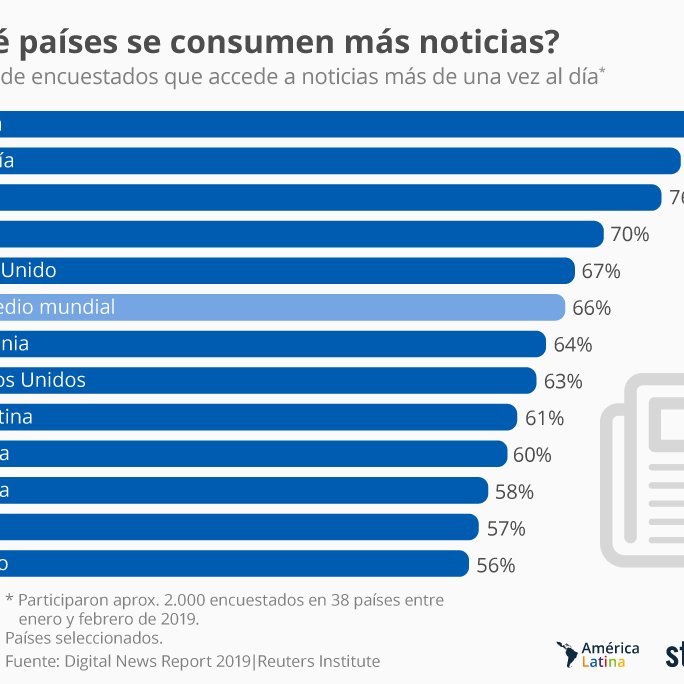
This infographic shows the percentage of people who say they watch, listen to or read news more than once a day in a selection of countries.
If you would like to be notified every time Statista publishes a new infographic, you can subscribe to their newsletter.
